

The Cost of Company Creation
Building a Standard Cost Structure for Venture Studios

In the previous issue, we discussed how studios create outsized returns for investors through their function as systematic company creators with rigorous validation processes and capital efficient development.
In this issue, we will talk about the cost structure of studios to support repeatable company creation. Too often, studios do not explain their cost structure to the point that (a) it is clear and intuitive for investors, and (b) showcases the studio’s company-creation process and the ability to generate meaningful returns. This is a two-sided loss: studios don’t receive funding and investors are left uninformed and uninspired on studios as an asset class.
Understanding the cost structure is important for investors not just from a diligence and fiduciary perspective, but also to adapt to the studio’s fundamental different economic model as compared to traditional VC funds.

Studios and VC: different operating models
To explain studio cost structures, we will start with Venture Capital funds. VC funds are the workhorse investment vehicle for start-up equity financing, and as a result, many capital allocates and LPs anchor their understanding of early-stage investments through the context of VC. As this issue will explain, venture studios are completely different than VC funds, but the bridge between the two helps to articulate why.
VC firms — compared to venture studios — have a simple operating model and simple cost structure. At a high-level, their job is to find good investments, apply due diligence, and make investments at a fair valuations. Other than some back-end tax, legal, and accounting relating to investments and portfolio management, there aren’t many more core operational activities for a VC firm.
Therefor VC primarily operates on a management fee model, typically around 2% of the fund size, to cover their operational overhead. LPs into VC funds are accustomed to paying the 2% on the expectation that the VC focuses their operations on deal sourcing and deal diligence. While some VC firms might offer support services to their portfolio companies, their operational costs are generally not as directly tied to the intensive, hands-on building of new ventures as in the studio model. Therefore the 2% annual fee (typically totaling about 20% over a fund's lifetime) is reasonably proportional to the work effort required from the Fund managers and their support team.
On the other hand, venture studios maintain much more expansive operations than just deal sourcing and diligence. Venture studios function as company creators, with operations geared towards ideation, validation, building, and launching multiple ventures simultaneously. Venture studios are also actively involved in the development of startups, acting as entrepreneurs, operators, and investors. This hands-on, collaborative approach requires a larger and more specialized in-house team including experts in technology, marketing, business development, sales, branding, and product development.

As one might expect, operations like the above require a significant budget as compared to VC. Indeed, venture studios typically spend 40-60% of their total capital on operations, which is two to three times more than a traditional venture capital fund. Presented without context, this statistic might be viewed as extreme overcharging for investment management, or unneeded wasted in the operational process. However, when presented with the context of the additional entrepreneurial and operator functions a studio executes, the costs become more intuitive and not an outright red flag for investors.
This striking difference also illustrates the fundamentally different business model that venture studios represent in the startup ecosystem. Furthermore, data points to this model being not only different, but potentially better, when it comes to generating investor returns. Yet despite their growing prominence and proven ability to systematically generate successful companies and returns , venture studios face a critical challenge:
Transparency in how their capital is allocated and consumed during the company creation process. Fundamentally investors want to know how much capital is required to build each company, and what equity allocation they receive as a result.
Updating the investment framework to encompass simultaneous ideation, operator, and investor roles. Simple allocations like “fee” and “deployed capital” no longer work in a multi-faceted studio operation.
When studios attempt to fit into traditional fund structures, the result is often complex accounting and legal arrangements that obscure rather than illuminate their true economics. This is inefficient for two reasons: (1) the investors don’t fully understand why the added cost create higher net returns*,*** and (2) investors become skeptical of the studio and lose trust in the studio’s ability to return capital.
In the next section, we institute a framework for the venture studio cost structure which provides both better accounting of the true cost input into company creation, as well as speaks to how those inputs drive value for both the studio and its investors.
The Venture Studio Cost Structure Model (VSCSM)
Five Essential Categories for Capital Allocation Transparency
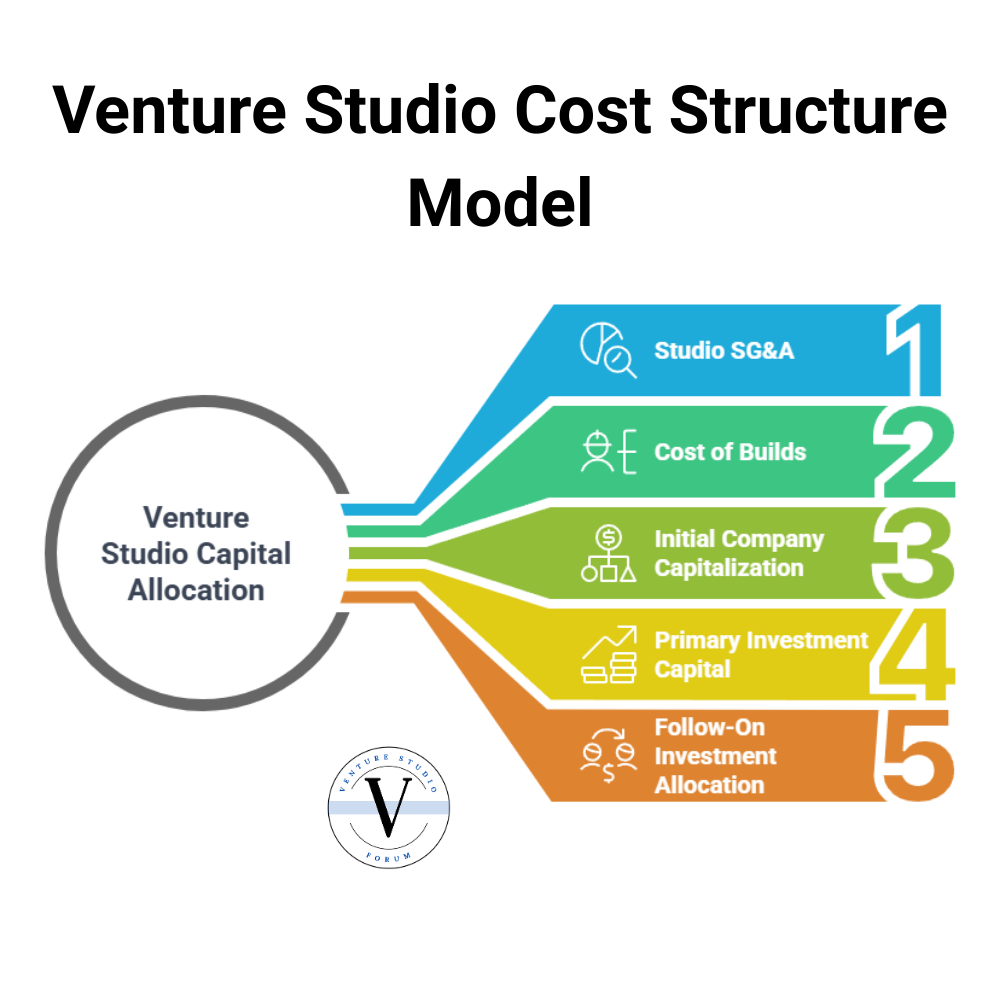
The VSCSM framework breaks down venture studio capital allocation into five distinct categories, providing investors with clear visibility into how their capital is deployed—regardless of the legal structures involved. Each category represents a fundamental and distinct use of capital in the company creation process.
1. Studio SG&A
Definition: Operating expenses required to maintain the studio entity itself, independent of specific portfolio company creation activities.
Components:
General administrative costs (legal, accounting, compliance)
Executive team salaries not directly allocated to company building
Studio facilities and infrastructure
Fundraising expenses
Investor relations
Financial Characterization: These expenses most closely parallel the management fee in traditional venture capital, representing the base operational costs required to sustain the investment platform.
Typical Allocation: 15-25% of total capital
2. Cost of Builds
Definition: Direct operational expenses incurred by the venture studio during the ideation, validation, and early development phases of building new companies, before the company is spun out from the studio.
Components:
Idea generation processes and systems
Market research and opportunity validation
Technical proof-of-concept development
Startup team personnel costs during company formation
Design, prototyping, and testing resources
Initial customer development activities
Financial Characterization: These are effectively "cost of goods sold" for the studio's core product—new companies. Unlike traditional VC where entrepreneurs bear these costs, in studios these expenses occur at the studio level.
Typical Allocation: 10-35% of total capital
3. Initial Company Capitalization
Definition: Minimal capital deployed into newly formed portfolio companies to legally establish the entity and secure common equity alongside the studio's "sweat equity" contribution.
Components:
Initial legal entity establishment costs
Minimum viable capital to activate the business
Analogous to founder's personal capital contribution in traditional startups
Basic expenses to move concept forward after validation decision
Typically very small amounts (under $50K in the US)
Financial Characterization: This represents the minimal financial foundation needed to establish the corporate entity, analogous to the personal funds a traditional founder would contribute. It is not intended to fund substantive operations but rather to complete the formal establishment of the company.
Typical Allocation: 0-10% of total capital
4. Primary Investment Capital
Definition: Structured investment capital typically securing preferred equity with investor protections, deployed as an internal investment round within the studio ecosystem.
Components:
Internal investment rounds structured similar to traditional VC investments
Initial substantive operating capital for the new company
Capital with defined terms, valuation, and investor protections
Funding for MVP development and initial market entry
Precedes any outside investor participation
Financial Characterization: This most closely resembles traditional venture investment, with similar approval processes, terms, and structures. It represents the studio's substantive financial commitment to the company, but occurs entirely within the studio ecosystem before outside investors are engaged.
Typical Allocation: 30-50% of total capital
5. Follow-On Investment Allocation
Definition: Capital designated for participation in subsequent financing rounds of portfolio companies, which may include pre-seed or seed rounds with external investors.
Components:
Pro-rata participation in external financing rounds
Strategic follow-on investments to maintain ownership or governance
Capital deployed to support demonstrated success cases
Participation in rounds that may include outside investors
Financial Characterization: Unlike seed and primary investments which occur at predictable stages of company development, follow-on investments are contingent on company performance and capital needs, requiring distinct allocation strategies.
Typical Allocation: 0-20% of total capital
This framework provides an improved classification of company creation costs which better reflect the underlying operations of a studio. More importantly, it creates a standard that can be applied regardless of whether a studio operates as a traditional fund, holding company, or dual-entity model.
Once these costs are tallied, investors gain valuable insights into the studio's strategic approach:
Capital Deployment Transparency: Investors can clearly see how their capital is being utilized across different aspects of the studio operation, from basic overhead to direct investment.
Strategy Alignment Verification: Investors can verify if the actual capital deployment aligns with the studio's stated strategy regarding company type, investment stage, and portfolio construction.
Risk Profile Assessment: The allocation across categories signals the risk profile and operating model of the studio, helping investors determine if it matches their investment thesis and return expectations.
Capital Efficiency Metrics: For each company, the studio will obtain a certain amount of equity in return for its contribution. The total costs from the VSCSM divided by the equity percentage become the cost of equity (on a percentage point basis), revealing how efficiently the studio converts capital into ownership.
Equity Type Analysis: The framework reveals what portion of capital secures common stock (typically with minimal investor protections) versus preferred stock (with standard investor rights and protections).
The VSCSM framework doesn't predict returns, but it provides the fundamental transparency investors need to make informed decisions about where to deploy their capital in the venture studio ecosystem.
Capital Sources and Uses: The Complete Picture
The five-category breakdown allows stakeholders to color-code or identify, within each category, what portion of capital comes from which source. This transparency becomes particularly valuable during due diligence, when sophisticated investors inevitably discover these nuances anyway. To illustrate, we present some example studios with hypothetical cost structures as catalogued by VSCSM.
Our hypothetical reference venture studio model focuses on:
A B2B SaaS with a 10-year lifecycle
3 years of active company creation followed by 7 years of portfolio management.
During the active period, a team of 8 (including 2 Managing Partners, technical leads, and EIRs) creates approximately 3 companies per year for a total of 10 companies.
Annual operational budget: $1M/yr while active, $100k/yr hold - $3.7M total
Investment structure: $25,000 common stock + $500,000 preferred equity per company - securing ~25% common and 20% preferred ownership at time of spinout - $5.25M total
~$1M for Follow-on
Post-build period (years 4-10) maintains minimal staffing with partners at ~10% time allocation
Assumes new fund raised by year 3 to maintain team continuity
Based on the provided studio design and the VSCSM framework's five capital allocation categories, here's an estimate of costs on a per portfolio company basis:
Per Company Cost Allocation (Based on 10 Companies Total)
1. Studio SG&A
Total allocation: $3.7M (operational budget) × 20% = $740,000
Per company: $74,000
2. Cost of Builds
Total allocation: $3.7M (operational budget) × 80% = $2,960,000
Per company: $296,000
3. Initial Company Capitalization
Per company: $30,000 (common stock)
4. Primary Investment Capital
Per company: $500,000 (preferred equity)
5. Follow-On Investment Allocation
Total allocation: $1,000,000
Per company: $100,000 (though likely not distributed equally in practice)
Total Investment Per Company: $1,000,000
Note: The operational budget allocation between SG&A and builds is estimated based on typical studio models where most of the team's time during the active period is dedicated directly to company building activities. The actual distribution may vary based on the studio's specific operating model and efficiency.

Independent of deal structure, these costs reflect the underlying use of the capital toward company creation and forming the cost basis of the studio’s equity allocation in the companies. With these costs, investors can quickly identify the following KPIs:
Total Studio Cost per Company: This metric measures the total operational expenditure of the studio allocated to a specific portfolio company. A lower cost indicates higher operational efficiency, $270,000 per company in our example.
Cost Per Equity Point: This metric calculates what it costs the studio to secure each unit of equity (both common and preferred) in its portfolio companies. It allows for a comparison of the studio's economics to traditional VC models, our example studio secures 45% in each portfolio company for an all in cost per company of $900k excluding follow on reserve, netting the studio 50% per million invested, or $20,000 per point of equity.
Ratio of Studio Expenses to Investment Capital: Analyzing this ratio helps understand how the studio uses its capital, indicating the balance between the cost of running the studio and the direct investment into portfolio companies. In our example, the studio is using $3.7M to build companies and run the studio of $10M, resulting in a ratio of 37%, nearly double the expected operations cost ratio of a traditional venture fund.
Studio Scalability Ratio: This measures the number of portfolio companies effectively supported by studio staffing. A higher ratio suggests better leverage of the studio's human resources. Our example studio achieves a Studio Scalability Ratio of 1.25 building 10 portfolio companies with a staff of eight.
How Capital Allocation Reveals Venture Studio Strategy
When evaluating venture studios, capital allocation patterns provide a window into strategic focus and risk appetite. The Venture Studio Cost Structure Model (VSCSM) framework enables investors to decode these patterns by standardizing how different studios deploy capital across five key categories.
Table 1: Capital Allocation Comparison Across Studio Types (% of total capital)
Below, we compare how four hypothetical but distinct venture studio models allocate their capital, revealing fundamental differences in approach and expected outcomes.

Deep Tech Studios: Building Value Through Technical Innovation
A $100M deep tech studio allocating 45% ($45M) to portfolio builds signals a strategy centered on creating significant value through technological development before formal company creation. This high allocation reflects the substantial resources required for scientific validation, prototyping, and specialized talent acquisition in frontier technologies.
With only 15% ($15M) allocated to follow-on investments, these studios typically rely on specialized external investors to lead later funding rounds. The disproportionate investment in company building versus follow-on reflects confidence that the technical value created will attract premium valuations from specialized investors.
Key Performance Indicator: In our example, assuming a portfolio of 25 companies and an average initial ownership of 65%, this studio spends approximately $3.4M per company built, securing 19.1% equity per million dollars invested (or $52,307 per equity percentage point).
Venture Studios: Capital Intensive High Growth
At $30M in fund size, the traditional venture studio model shows a more balanced approach, with 35% ($10.5M) allocated to building companies and 25% ($7.5M) to follow-on investments. This allocation reflects the dual focus on both creating innovative business models and supporting their competitive growth in fast-moving markets.
The higher proportion of follow-on capital (compared to deep tech) indicates recognition that maintaining meaningful ownership through multiple competitive funding rounds is critical to returns in traditional venture sectors, where technical barriers to entry may be lower.
Key Performance Indicator: With approximately 14 portfolio companies and an average initial ownership of 35%, this studio spends $1.6M per company built, securing 21.8% equity per million dollars invested (or $45,918 per equity percentage point).
PE-Focused Studios: Balancing Creation and Growth
The $50M PE-focused studio demonstrates a radically different allocation strategy, with 50% ($25M) dedicated to primary investment capital and 0% to both initial capitalization and follow-on investment. This distinctive pattern reflects a strategy centered on building companies specifically for complete acquisition by private equity firms.
Unlike venture-oriented studios, PE-focused studios don't allocate capital to follow-on rounds because they're building for a single acquisition event rather than a multi-stage funding journey. Additionally, they often bypass the typical initial capitalization stage, instead moving directly to substantive investment once a concept is validated.
The higher administrative allocation (25% or $12.5M) typically supports specialized industry experts who can identify opportunities in established markets with clear acquisition potential and prepare companies for the stringent due diligence of PE acquirers.
Key Performance Indicator: Across approximately 25 portfolio companies with an average initial ownership of 75%, this studio spends $2M per company built, securing 37.5% equity per million dollars invested (or $26,666 per equity percentage point). These metrics reflect the focus on building businesses with clear unit economics and established acquirers rather than pioneering new technologies.
Cashflow Studios: Efficient Execution with Near-Term Returns
The $10M cashflow-focused studio allocates 35% ($3.5M) to building companies and 50% ($5M) to primary investment, striking a balance between value creation and direct investment. This allocation emphasizes capital efficiency and a focus on business models with near-term revenue potential.
The lack of follow-on allocation indicates less dependence on multiple rounds of equity financing to achieve profitability, consistent with a strategy targeting cash-generating businesses rather than growth-at-all-costs models. The lower operational costs of the studio are partially enabled by the potential for near term distributions of profit back to the studio.
Key Performance Indicator: With approximately 20 portfolio companies and an average initial ownership of 55%, this studio spends $500,000 per company built, securing 110% equity per million dollars invested (or $9,090 per equity percentage point).
Analytical Insights for Investors
The VSCSM framework reveals several critical insights for investors evaluating venture studios:
Cost of Builds as Technical Risk Indicator: The percentage allocated to building companies directly correlates with the technical risk and innovation intensity of the studio's strategy. Deep tech studios (45%) require substantially more resources to validate and develop new technologies compared to PE-focused studios (25%).
Equity Efficiency Varies by Strategy: The amount of equity secured per million dollars invested varies dramatically across studio types. Cashflow studios demonstrate the highest efficiency (110% equity per $1M), while deep tech studios show the lowest (19.1% equity per $1M), reflecting fundamental differences in how value is created and captured.
Follow-On Strategy Signals Exit Timeline: The proportion allocated to follow-on investment reveals the studio's assumptions about exit timelines and external capital dependence. Traditional venture studios maintain the highest allocation (25%), indicating recognition of longer paths to exit requiring multiple funding rounds.
Portfolio Concentration Reflects Risk Approach: The number of companies created with similar capital bases varies significantly, from 14 companies (venture studio) to 25 companies (PE-focused studio) with comparable fund sizes, revealing different approaches to portfolio diversification and risk management.
When evaluating venture studios, investors should use the VSCSM framework to ensure capital allocation aligns with stated strategy and risk appetite. The patterns revealed through this analysis provide a more transparent view of how studios actually operate, beyond the marketing language or legal structures that might otherwise obscure their true approach to value creation.

Moving Forward With Transparency
The venture studio model represents a fundamental innovation in company creation, not merely an extension of traditional venture capital. As such, it deserves evaluation frameworks that match its unique characteristics rather than forcing it into ill-fitting legacy models.
By standardizing how we analyze capital allocation across the venture studio ecosystem through the VSCSM, we can accelerate understanding of this emerging asset class. More importantly, we can foster honest conversations between studios and their investors about the true costs of company creation and the value these costs generate.
Transparency doesn't mean conformity. Different studios will show different capital allocation patterns based on their focus, maturity, and strategy. What matters is that these patterns become visible and comparable, allowing the market to efficiently direct capital to the most effective practitioners.
Key Takeaways
The VSCSM framework cuts through complex legal and accounting structures to reveal the true economics of venture studios;
By providing transparency on operational costs versus direct investment, studios can better align with investor expectations;
Investors can use this framework to make meaningful comparisons between studios and against traditional venture models;
The approach enables evaluation of investment efficiency through metrics like cost-per-equity-point;
Historical parallels suggest that standardized metrics will be essential for the venture studio model to secure its place in institutional portfolios;
Appendix: VSCSM and Common Studio Investment Structures
Whether a studio organizes as a single Fund, a holding company, or a dual entity structure, the cost structure remains the same, and the only thing that changes is where/how each cost item gets allocated:
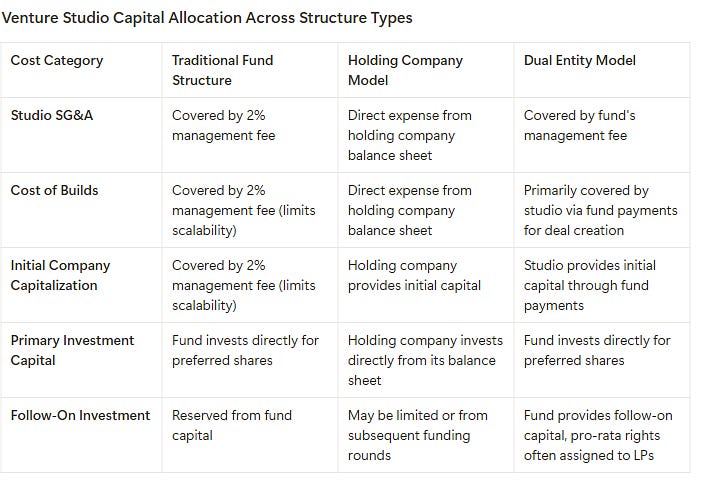
Traditional Fund Structure (Single Entity Model)
Investment: Investors, known as Limited Partners (LPs), invest capital into a single fund entity. The studio team acts as the General Partner (GP) or fund manager. This structure is familiar to traditional venture capital investors. Funds operating under this structure tend to be larger, typically $50 million or more.
Fees: This model typically follows the "2/20" structure: a 2% annual management fee based on the invested capital and 20% carried interest (carry), which is a performance fee based on the fund's profits after returning the initial capital to LPs. However, to cover the higher operational costs of a venture studio, the management fee and carry might be higher than the market average, or modifications to the fee structure might be implemented. These modifications can include carried interest step-ups upon meeting performance hurdles, accelerated fee schedules, or a carry waterfall applied to individual portfolio companies. The management fee is used by the studio to cover team expenses and operational overhead in building new companies.
Equity: The fund itself owns the equity in each startup created. LPs benefit from the returns generated by these equity stakes, receiving 80% of the gains after their initial capital is returned (plus any preferred return), while the GP (studio team) receives 20% as carried interest. The studio gets some equity in each startup created, but ultimately, the fund (owned by the LPs) holds these shares.
Holding Company Model (Single Studio Model)
Investment: Investors purchase a fixed percentage of ownership directly in the studio, which is structured as a holding entity (e.g., a C-corp or LLC). Investors contribute their full capital upfront at the time of subscription. These raises are typically smaller, ranging from $1 million to $50 million. Treating the holding company as a direct investment often leads to discussions around the valuation of the studio itself. Investor ownership in the holding company often ranges from 25% to 50%, with the balance held by the studio's general partners and staff.
Fees: There are no traditional management fees or carried interest in this model. The studio's operations and the funding for new ventures come directly from the cash on the holding company's balance sheet. The studio's operational costs are considered value-additive investments in creating portfolio companies.
Equity: The holding company itself holds the equity in the startups it creates. Investors in the holding company indirectly benefit from the success of these portfolio companies through the appreciation in the value of their stake in the holding company and eventual distributions. The studio staff and GPs' ownership in the holding company effectively acts as their "carry" and incentivization. The initial ownership targets in portfolio companies for holding companies tend to be higher, averaging around 43%.
Dual Entity Model (Fund and Studio Pairing)
Investment: This model involves two separate entities: a holding company (the operating studio) and a dedicated fund. Investors (LPs) invest in the traditional fund, which operates with a standard fee and carry structure. A key aspect is that the fund typically makes an initial investment into the holding company. This investment provides the studio with early capital to cover operating costs and startup formation. In some variations (independently funded holding company), the holding company might also raise capital from other investors besides the affiliated fund, such as angel investors or family offices.
Fees: The fund typically charges a management fee (often 2-2.5%) and carried interest, similar to a traditional VC fund. The fund's initial investment in the studio can be seen as a way to address the management fee issue of the single studio model by providing liquidity to the studio. In some dual entity structures, the management fee might be dropped or reduced, with the fund's investment in the holding company serving as the primary source of operational capital. The studio might also charge a management fee to the fund.
Equity: The studio (holding company) typically receives common shares in the startups it creates, acting as a founder. The fund invests directly in the best startups emerging from the studio's pipeline, usually receiving preferred stock. The fund's initial investment in the holding company also grants it an indirect share in each startup created by the studio, often through a portion of the studio's common stock. This structure aims to provide capital-efficient ownership for the fund. Initial ownership targets for the holding company in portfolio companies can range from 30-60%, while the fund might target 10-20%.
All three structures are valid in how they raise money from investors and supply capital toward company creation. However, each structure handles all 5 of the cost and capital categories differently, creating a matrix of different metrics to follow and understand.
About the Authors
Matthew Burris serves as the Senior Director of Research at the Venture Studio Forum, where his mission is to transition venture studios from an emerging asset class to an established asset class. In this role, he leads the creation of the rigorous data frameworks and due diligence standards required for institutional adoption.
This research is built upon the proprietary insights Matthew developed as Partner & Head of Insights at the 9Point8 Collective. By codifying the methodologies from his advisory work with corporate, university, economic development, and private studios, he provides the Forum with the foundational architecture needed to define the industry.
Connect with Matthew on LinkedIn.
Hello there,
Huge Respect for your work!
New here. No huge reader base Yet.
But the work has waited long to be spoken.
Its truths have roots older than this platform.
My Sub-stack Purpose
To seed, build, and nurture timeless, intangible human capitals — such as vision, resilience, trust, truth, evolution, fulfilment, quality, peace, patience, discipline, relationships and conviction — in order to elevate human judgment, deepen relationships, and restore sacred trusteeship and stewardship of long-term firm value across generations.
A refreshing take on our business world and capitalism.
A reflection on why today’s capital architectures—PE, VC, Hedge funds, SPAC, Alt funds, Rollups—mostly fail to build and nuture what time can trust.
“Built to Be Left.”
A quiet anatomy of extraction, abandonment, and the collapse of stewardship.
"Principal-Agent Risk is not a flaw in the system.
It is the system’s operating principle”
Experience first. Return if it speaks to you.
- The Silent Treasury
https://tinyurl.com/48m97w5e