

The Death of the 10-Year Fund
The Case for Structural Liquidity

In 1959, the venture capital industry adopted a fund structure borrowed from real estate and private equity, a 10-year closed-end vehicle designed for an era when startups went public in five to seven years. Sixty-six years later, the median VC-backed exit takes nine years, nearly half of all unicorns have been held for nine years or more (per Yadav), and LP net cash flows have been negative by $169 billion since 2022 (per PitchBook-NVCA data). The structure did not break overnight. It was simply never designed for what venture capital became.
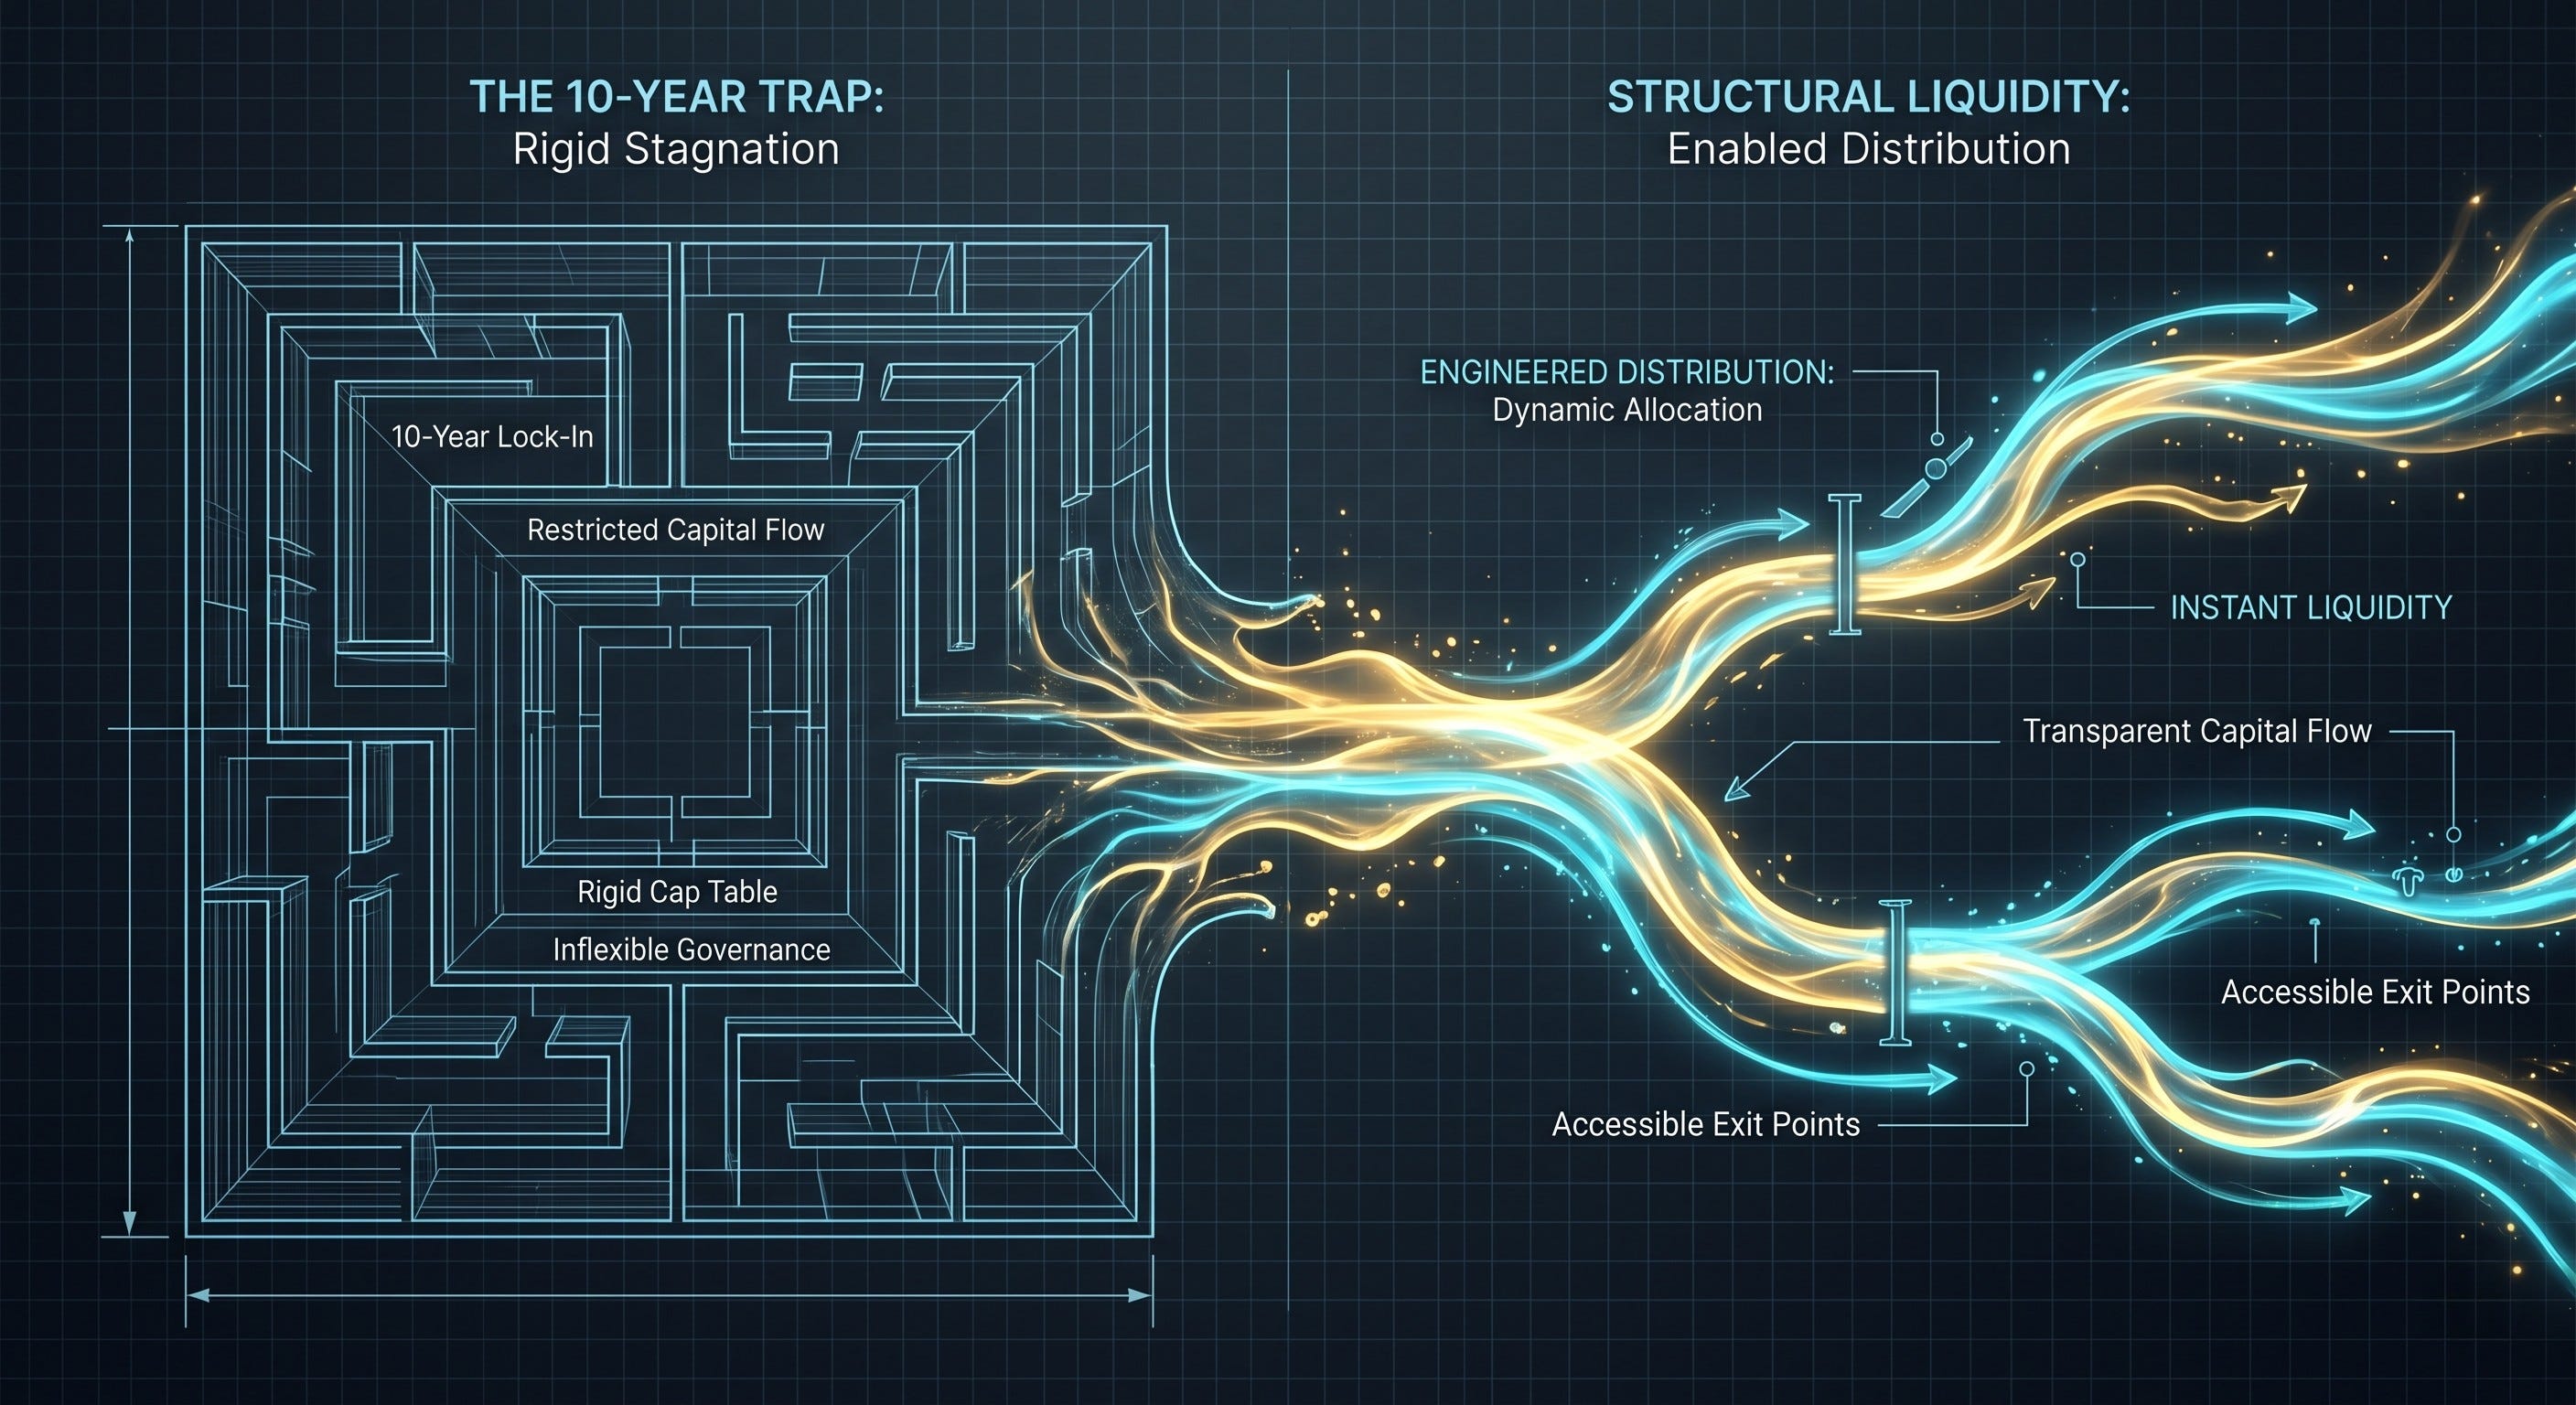
Venture studios sit at the center of the structural response. Not because they are new, the model has been operating for over a decade, but because they are architecturally positioned to do what the 10-year fund cannot: engineer liquidity as a design feature rather than wait for it as a market event. The fund model treats liquidity as an outcome. Studios treat it as a product specification.
The bottom line: The 10-year closed-end fund is a 1959 relic operating in a 2025 market where $947 billion sits locked across 58,000+ private companies and even top-quartile 2017 vintage funds have barely returned half their capital. The fix is not better fund selection or more patient waiting. It is a new architecture. Call it Structural Liquidity: fund designs, secondary mechanisms, and operational models that engineer cash distributions into the vehicle from inception rather than hoping the exit market cooperates at year ten.
The DPI Crisis: Paper Wealth, No Cash
The LP liquidity drought is the most severe systemic threat to venture capital since 2009. Since 2022, net cash flows to LPs have been negative by $169 billion (per PitchBook-NVCA data). Across the ecosystem, $947 billion sits locked in more than 58,000 private companies (per Yadav). And 2024 saw disclosed exit values fall to a decade low (per PitchBook-NVCA data).
The DPI data exposes the scale by vintage:
2017 vintage: Median DPI of 0.28x, funds now eight-plus years old have returned roughly a quarter of invested capital. Even the top quartile just recently passed 0.51x (per PitchBook-NVCA data).
2019-2022 vintages: Median DPI of 0.00x. Zero cents returned on the dollar.
These are not J-curve timing artifacts. Capital is being recycled into follow-on rounds rather than returned. Markups exist on paper but no cash has been distributed. LPs cannot recycle into new commitments because there is nothing to recycle. These vintages are not “early.” They are structurally impaired.
Without distributions, LPs cannot commit to new funds. Their venture allocation remains artificially high, not because venture is performing, but because the capital is trapped. Seventy-two percent of LPs now report reducing their VC allocations. Not rotating. Reducing.
This creates a doom loop. GPs cannot exit, so they cannot distribute. LPs receive no cash, so they cannot fund new vehicles. Startups get trapped in defensive financing: bridge rounds account for 29% of priced seed rounds and 26% of Series A rounds; down rounds persist at 13.8-16.2% throughout 2024-2025 (Carta). New capital sources, sovereign wealth funds, retail through interval funds, insurance balance sheets, can break the loop from outside, and some are. But the core LP base that drove the industry’s growth is constrained, and new entrants alone do not offset the $169 billion liquidity deficit. The ecosystem is eating itself.
The Zombie Economy and the Fee Machine
The 10-year fund structure does not merely trap capital. For funds past their intended life with no realistic exit upside, it creates economic incentives to keep capital trapped. A $1 billion fund generates $20 million per year in management fees at a standard 2% rate (per Wood). The longer a GP extends fund life, the longer those fees flow. A massive cohort of funds aged 11-15 years still holds 20-30% of NAV unreturned (per Wood). These are not GPs patiently nurturing late-stage winners; they are GPs maintaining fee streams on companies that will never generate meaningful exits. For these zombie funds, the incentive structure has inverted: the GP’s guaranteed income (fees) increases relative to their performance-linked income (carry) the longer capital stays locked. For top-performing funds, carry still dominates GP economics over a full fund life. But the fee incentive applies at the margin across the industry, and the margin affects LP cash flows.
Mark-to-Liquidity: A Framework for Structural Assessment
Standard metrics, IRR, TVPI, DPI, each capture a dimension of fund performance, but none measures the one thing LPs actually need: the ability to convert portfolio value into cash on a defined timeline. Call it Mark-to-Liquidity, a framework for evaluating any venture vehicle based on its structural capacity to generate distributions, not its paper markups.
Mark-to-Liquidity asks three questions of any fund structure:
1. What is the engineered distribution timeline? Not the projected timeline based on optimistic exit assumptions, the timeline that the structure itself enables. A 10-year closed-end fund has no engineered distribution mechanism. It depends entirely on exit markets. A studio fund with built-in secondary sales at follow-on rounds has a defined mechanism. The question is whether liquidity is a structural feature or a market-dependent hope.
2. What is the cost basis relative to secondary viability? A fund that acquires equity at market prices (traditional VC) needs a substantial markup before partial sales become economically rational. A vehicle that creates equity at cost (venture studio) can sell partial positions at any follow-on round and generate meaningful returns. Cost basis determines the earliest point at which liquidity becomes available, not in theory, but in practice.
3. What are the GP’s economic incentives around distribution timing? If the GP earns management fees regardless of distribution pace, the structure incentivizes delayed liquidity. If the GP’s economics are tied to realized returns on a defined schedule, the incentives align with LP liquidity needs.
Mark-to-Liquidity is not a replacement for DPI. It is a diagnostic that explains why DPI is what it is, and whether a given structure has the architectural capacity to improve it, or whether improved DPI depends entirely on market conditions beyond anyone’s control.
The Emerging Architecture of Structural Liquidity
The venture industry is not standing still. A set of innovations is assembling the building blocks of what replaces the 10-year fund. None alone solves the problem. Together, they constitute an emerging architecture. Call it Structural Liquidity, the deliberate engineering of distribution mechanisms into venture vehicles from inception.
Programmatic Secondaries and Recurring Tender Offers
SpaceX and Stripe pioneered the Recurring Tender Offer: a structured process, conducted every six to twelve months, that allows employees and early investors to sell shares at a slight discount (typically 10-20% below the most recent primary valuation) to pre-approved buyers. The broader secondary market remains small, roughly $60 billion against $3.2 trillion in primary unicorn value, less than 2%, but secondary-specific dry powder has more than doubled since 2022 to $9.8 billion.
Against the Mark-to-Liquidity framework: Programmatic secondaries score well on engineered distribution timeline, they create defined windows rather than waiting for exit markets. For traditional VC funds selling individual portfolio positions (direct company-share secondaries), discounts typically run 10-20%. The separate LP fund-position secondary market, where LPs sell their entire fund commitments, trades at steeper discounts of 30-40%. These are distinct markets with different dynamics. The cost basis challenge applies to both: VC funds that entered at market prices need meaningful markup before any secondary sale becomes economically rational.
Evergreen and Hybrid Vehicles
Evergreen funds, open-ended vehicles that reinvest profits and do not force arbitrary 10-year liquidations, address the duration mismatch directly. Rolling funds built on quarterly subscription models allow continuous entry and exit. Interval funds permit periodic redemptions at defined windows. Adoption is accelerating as the limitations of closed-end vehicles become undeniable.
Through the Mark-to-Liquidity lens: Evergreen vehicles score well on distribution timeline (programmatic redemption windows) and GP incentive alignment (ongoing fundraising depends on demonstrated distributions). But they carry redemption risk, if multiple LPs redeem simultaneously, the vehicle may face forced sales at unfavorable prices.
The Merchant Banking Pivot
Family offices are leading the structural shift. Rather than committing to blind-pool 10-year funds, they are adopting merchant banking platforms, taking direct equity stakes in operating companies, writing co-investment checks, and deploying from balance sheets with 100-year duration capital. They want ownership stakes alongside operators in “repeatable engines that scale across cycles.”
Mark-to-Liquidity assessment: Merchant banking scores highest on GP incentive alignment, the investor and operator are the same entity, eliminating the fee-driven hold incentive. Cost basis is typically low (direct ownership). Distribution timeline is flexible but unstructured, which can cut both ways.
Show the Math: Studio-Engineered Liquidity vs. the 10-Year Trap
The studio model’s structural advantage is not theoretical. It is arithmetic. Walk through the portfolio economics of three distinct vehicles investing at the same time, into the same market, and the gap between engineered liquidity and market-dependent hope becomes concrete.
Three Vehicles, Three Architectures
Consider three fund structures, each targeting early-stage companies:
A $8.4M Pre-Seed VC fund that invests $350K per company, securing 6.8% equity at a Cost Per Point of Equity (CPPE) of $51.5K. Portfolio of 20 companies.
A $48M Seed VC fund that invests $2M per company, securing 8.6% equity at a CPPE of $231K. Portfolio of 20 companies.
A $12M Venture Studio that deploys $900K per company, securing 35% equity at a CPPE of $25.7K. Portfolio of 10 companies. The studio’s thesis: build each company to Seed-stage viability and beyond.
The CPPE gap is the foundation everything else builds on. The studio acquires a point of equity for $25.7K. The pre-seed fund pays twice that. The seed fund pays nine times that. This is not a rounding error. It is a structural cost advantage that compounds through every subsequent round and determines when, and whether, liquidity becomes economically rational.
Dilution Through Series A: What Each Vehicle Actually Owns
Every round dilutes every prior investor. Carta’s Q4 2025 data shows median dilution of 19.4% at Seed and 19.2% at Series A. Applied uniformly across all three vehicles, here is what each one holds after each round:
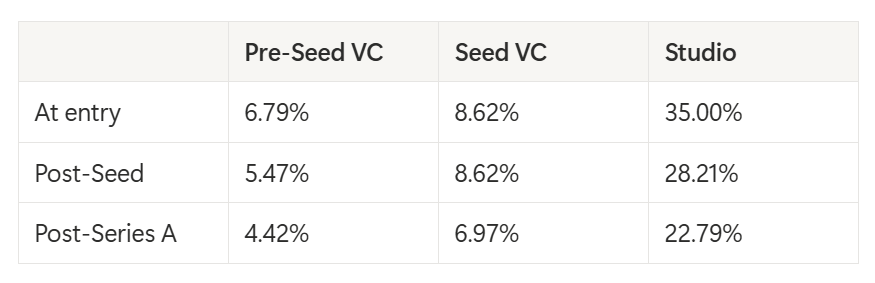
The studio enters with 5x the ownership of a pre-seed fund and 4x the ownership of a seed fund. After two rounds of dilution, it still holds 22.79%, more than three times the seed fund’s position and five times the pre-seed fund’s. The cost basis created the gap. Dilution did not close it.
Portfolio Size and the Path to Series A
These three vehicles do not just differ in cost basis. They differ in how many companies survive to the point where early liquidity becomes possible.
The graduation rate data frames the probabilities. Roughly 45–55% of pre-seed-backed companies graduate to a seed round (Incisive Ventures, 2025). From seed to Series A, mature cohorts (2017–2020 vintages) eventually saw 50–60% of companies graduate over a four-year horizon, with the 2019 Q1 cohort reaching 49.1% by its sixteenth quarter (Crunchbase, 2025; Carta via SaaStr, 2025). These are the eventual rates for well-performing funds across full fund lives, not the compressed two-year snapshots that dominate current headlines. Current two-year graduation rates have collapsed: Carta data shows only 15.4% of Q1 2022 seed companies reached Series A within two years, down from 30.6% for Q1 2018 (Carta via Chronograph, 2025). The model uses the historical eventual rates, which means the VC assumptions below are generous to the traditional model. Current market conditions would widen the gap further.
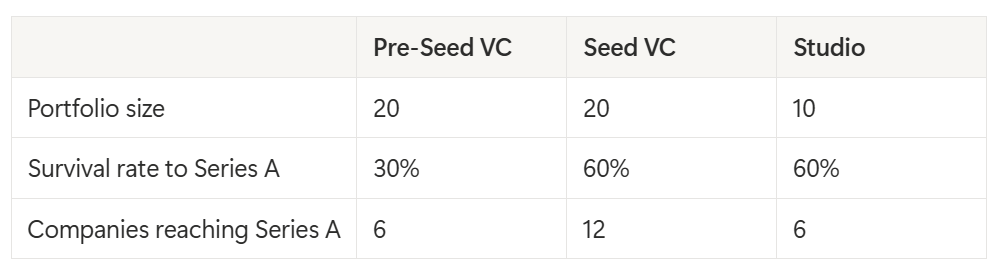
For the pre-seed fund, survival to Series A is a compound event: pre-seed to seed, then seed to Series A. At 50% × 60%, the compound probability is 30%. For the seed fund, the single-stage eventual rate for a well-performing fund is 60%, the top of the mature-cohort historical range. Both columns use the same underlying 60% seed-to-Series A rate. The pre-seed fund simply has an additional stage of attrition on top of it.
For the studio, the GSSN data provides the benchmark: 84% of studio-built companies reach seed funding, and 72% of those convert from seed to Series A, yielding a 60% inception-to-Series A rate across a sample of 258 startups from approximately 40 studios (GSSN, “Disrupting the Venture Landscape,” 2020).
Applied to each portfolio:
The Early Exit Test: What Selling at Series A Actually Looks Like
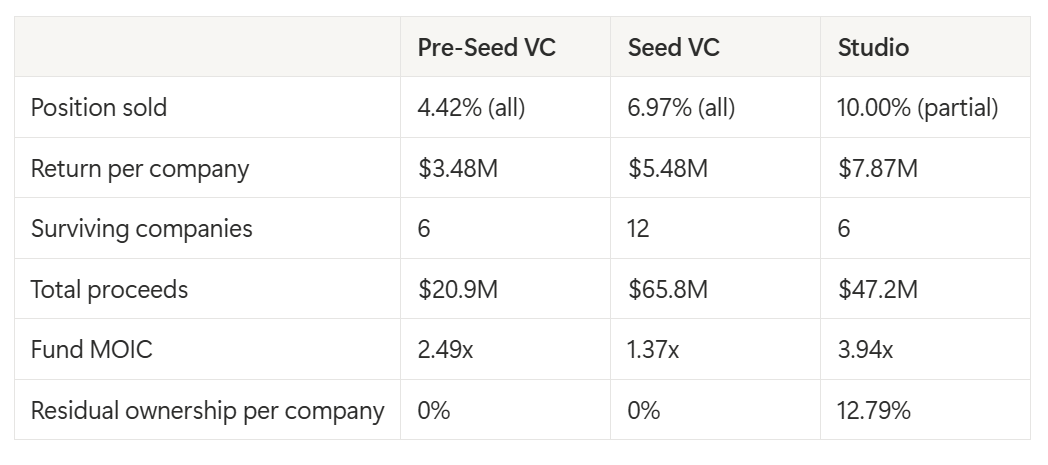
Now the question that exposes the structural difference. Assume each vehicle attempts to generate liquidity at the Series A. Carta’s Q4 2025 data shows a median Series A post-money valuation of $78.7M. What happens when each vehicle sells?
The pre-seed fund sells its entire 4.42% position in each graduating company. There is no partial sale here. The position is too small to split. Each sale generates $3.48M. Across 6 survivors, that is $20.9M in total proceeds on an $8.4M fund, a 2.49x MOIC. Respectable on paper, until you realize the fund has completely exited every position. There is no residual upside. Every dollar of future value in those six companies belongs to someone else.
The seed fund sells its entire 6.97% position. Each sale generates $5.48M. Across 12 survivors, that is $65.8M on a $48M fund, a 1.37x MOIC. The seed fund has a higher survival rate, more graduating companies, and larger absolute proceeds, and it barely clears cost. The high cost basis makes the math brutal. Even selling everything, with a strong survival rate, the fund returns thirty-seven cents on every dollar beyond the original investment. And like the pre-seed fund, it now holds nothing.
The studio sells 10% of each graduating company at the Series A post-money valuation. Not its entire position. A defined fraction of the company, executed as part of the universal secondary policy established at formation. Each sale generates $7.87M at par (before any secondary discount). Across 6 graduating companies, that is $47.2M on a $12M fund, a 3.94x MOIC.
And here is the line that matters: after selling, the studio retains 12.79% ownership in each graduating company. That residual position is larger than what the pre-seed fund secured at its initial investment (6.79%), larger than what the seed fund secured at its initial investment (8.62%), and larger than what a single Series A lead typically holds after syndicating the round. The studio took partial profits, returned nearly four times the fund, and still holds more equity in each company than either VC fund started with.
The VC funds liquidated completely and have no future upside. The studio generated superior returns from a partial sale and retained the largest individual position on the cap table below the founders.
Stress-Testing the Studio: Survival Rates and Secondary Discounts
The numbers above assume a 60% graduation rate and a sale at par. Reality will involve lower graduation rates for some cohorts and secondary discounts reflecting information asymmetry in a still-maturing market. The model must hold under stress.
The sensitivity matrix below varies two dimensions: graduation rate (60%, 50%, 40%) and secondary discount to the Series A post-money valuation (0%, 15%, 30%). All figures represent MOIC from partial secondary sales only. The retained 12.79% positions in each graduating company are not captured here. They represent additional upside above every number in this table.
Studio Portfolio MOIC from Partial Secondary Sales at Series A
10 companies, $900K each, $12M fund. Sale = 10% of each graduating company. Non-graduating companies written off entirely.
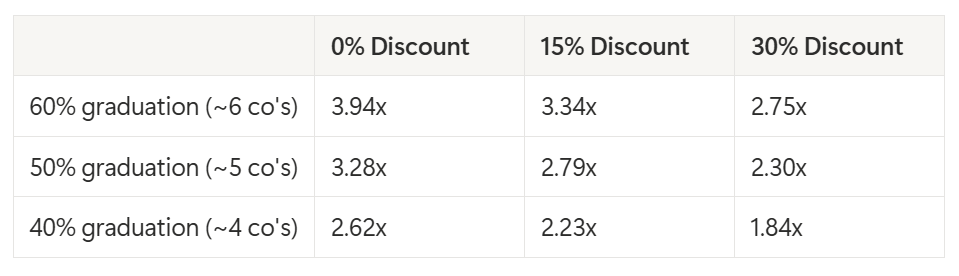
At the most conservative assumptions in this matrix, 40% graduation with a 30% secondary discount, the studio still returns 1.84x from partial sales alone while retaining meaningful ownership positions across every surviving company. At the realistic base case, 50% graduation with a 15% discount, the return is 2.79x before any value is assigned to the retained equity.
For comparison: the pre-seed VC at 2.49x and the seed VC at 1.37x represent complete liquidation scenarios with zero residual positions, using historically generous survival assumptions. The studio outperforms both at every point in the sensitivity matrix except the extreme downside corner, and even there it retains equity positions that the VC funds have already surrendered.
The Structural Comparison
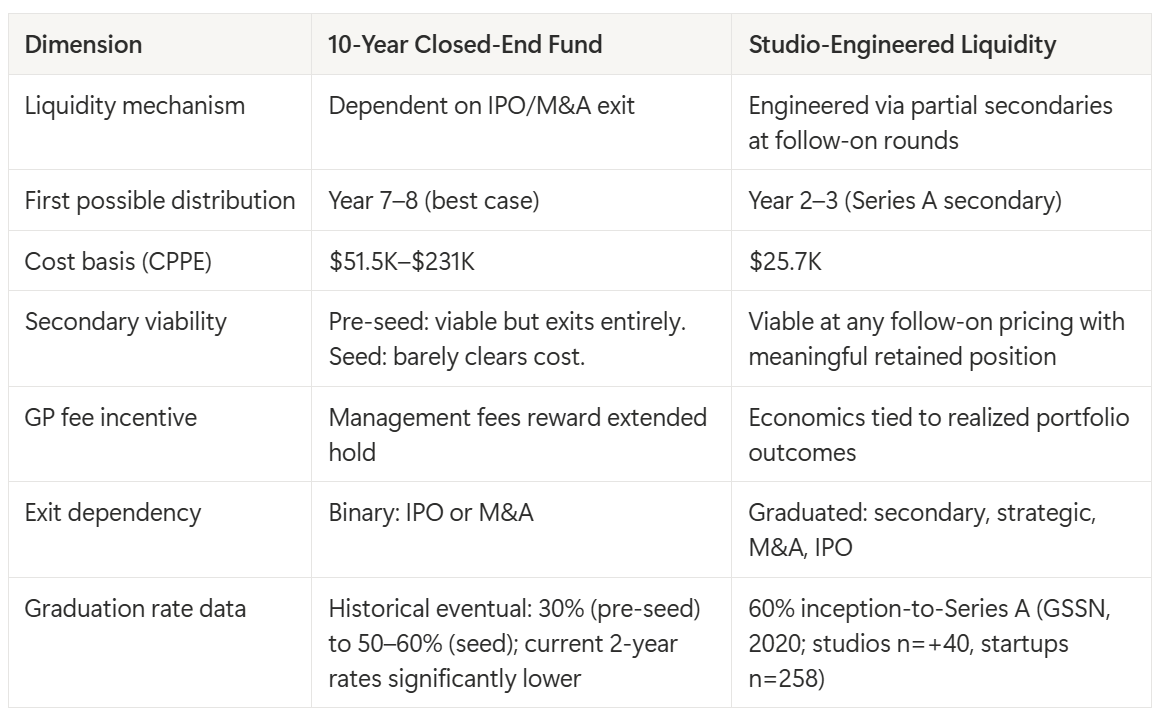
What This Model Requires
The studio model creates liquidity options at lower cost. It does not create liquidity guarantees. Four structural conditions must hold for the economics above to work.
Adverse selection is a real objection, and the studio model’s answer is to remove seller discretion entirely. A universal secondary policy, selling a fixed percentage of every graduating company at every Series A regardless of how the company is performing, eliminates the information asymmetry that drives the lemons problem. When the sale is pre-committed at formation, there is nothing for the buyer to infer from the fact of a sale. The decision was never in the information space to begin with. This is not just a defense against adverse selection. It is better operating posture across the entire capital stack. Series A leads know the secondary terms before they term-sheet. Founders understand the mechanic from day one. Studio staff are not relitigating the decision at every follow-on. Current and future investors can model the behavior forward. Case-by-case secondary decisions inject uncertainty into every follow-on negotiation and damage standing with the downstream capital the model depends on. The discipline requires giving up the option to hold the best graduates longer, a real cost, but a predictable liquidity program that institutional allocators can diligence and Series A leads can accept is worth more than the optionality to time individual sales.
Graduation rate sensitivity is high. The sensitivity table shows the math plainly. If graduation rates drop to 40% instead of 60%, portfolio MOIC from partial sales falls from 3.94x to 2.62x at par, and to 1.84x at a 30% discount. The model requires genuine operational depth, not passive portfolio management. Studios that cannot consistently graduate companies to Series A do not generate the liquidity events the model depends on.
Operating cost drag is real. The $900K per company figure covers direct company creation costs. Studio overhead, the team, infrastructure, and institutional capability required to run the model, is a separate cost that erodes portfolio-level returns. Studios must amortize this overhead across enough companies per cohort to maintain the economics.
Scaling barriers are structural. Studios require deep technical and operational benches that few GP teams possess. This limits how quickly the model can scale across the industry. Allocators seeking studio exposure should evaluate operational capacity as rigorously as they evaluate returns.
Secondary events must also be structured to preserve founder alignment. Introducing new investors onto the cap table at Series A has governance implications: board composition, pro-rata rights, information rights, and founder incentive alignment all require careful structuring. Series A leads often resist or condition insider secondaries because they want capital going into the company, not to existing investors. Studios that engineer liquidity responsibly build these protections into their operating agreements from day one and structure the universal secondary policy so that Series A leads can underwrite it at term-sheet stage.
Why haven’t studios displaced VC already? Because GP economics in traditional VC favor blind-pool AUM accumulation over operational company building. ERISA and institutional frameworks assume fund structures. Studio operational complexity limits the talent pool of GPs who can execute the model. And historical inertia favors the incumbent, it is far easier to raise a fund than to build a studio. These are not arguments against the model. They are explanations for why adoption has been gradual despite superior unit economics.
What This Means for Allocators
The 10-year fund is not dying because of a bad cycle. It is dying because the market it was built for, fast IPOs, compressed timelines, small fund sizes, no longer exists. The exit timeline has doubled. The capital base has grown a thousandfold. The incentive structure rewards GPs for keeping capital locked rather than returning it.
Allocators face three strategic choices:
Accept the structure and wait. This assumes exit markets will reopen, DPI will recover, and the 2019-2022 vintages are “early” rather than impaired. The evidence does not support this position, but institutional inertia makes it the most common one.
Demand structural modifications within the existing model. Negotiate for lower management fees during extension periods. Require GP co-investment. Insist on defined secondary sale windows. These modifications address symptoms, but they do not change the fundamental architecture. A 10-year fund with better fee terms is still a 10-year fund.
Allocate to vehicles with Structural Liquidity built in. Studio funds with engineered secondary windows at follow-on rounds. Evergreen vehicles with programmatic redemption. Co-investment platforms with defined liquidity events. Merchant banking structures with balance-sheet duration. These vehicles do not depend on exit markets for distributions. They engineer distributions into the vehicle design. This option is capacity-constrained today. Studios with the operational depth to execute this model are a fraction of the over 1,100 studios globally (InNiches, “Big Venture Studio Research,” 2024). Allocators should evaluate operational capacity as rigorously as they evaluate returns.
The third option requires new due diligence frameworks. Mark-to-Liquidity provides the evaluative lens:
Mark-to-Liquidity Due Diligence: Five Questions for IC Evaluation
What is the fund’s modeled distribution waterfall by year, and what assumptions drive each liquidity event?
What is the cost basis per point of equity, and at what follow-on valuation does secondary sale become economically rational?
What historical vs. modeled DPI data can the GP provide by vintage?
What secondary market access provisions are embedded in the fund documents?
What governance protocols exist around liquidity events, who approves sales, what are conflict-of-interest safeguards, what is the reporting cadence?
These are structural questions, not performance questions, and they must be answered before a single dollar is committed, not after year eight when the DPI line reads 0.28x.
The Architecture After the 10-Year Fund
The 10-year closed-end fund was a good idea for 1959, a clean structure that matched capital duration to company timelines when companies went public in five to seven years. The mistake was leaving the architecture unchanged for 66 years while everything it was designed to contain transformed beyond recognition.
The replacement is not a single structure. It is an ecosystem of vehicles designed around a shared principle: liquidity must be engineered, not hoped for. Structural Liquidity connects programmatic secondaries, evergreen vehicles, studio-built portfolios, and merchant banking platforms. They differ in form. They share a structural commitment to solving the problem the 10-year fund created by ignoring it.
Venture studios occupy a distinct position in this architecture. A model that creates companies at a $25,000 CPPE, reaches Series A liquidity events in 25 months, and can sell partial positions at any follow-on round is not retrofitting liquidity onto an existing structure. It is building liquidity into the cost basis from day one.
The 10-year fund will not disappear overnight. Institutional inertia, GP economics, and regulatory frameworks will sustain it for years. But the $169 billion in negative LP cash flows, the vintage years at 0.00x DPI, and the 72% of LPs reducing allocations are not signals of a cycle. They are signals of a structure that has outlived its design parameters.
The venture industry built an extraordinary engine for funding innovation. It housed that engine in a 1959 chassis. The chassis is failing. The question is no longer whether to redesign it, but who will build what comes next.
Citations
PitchBook-NVCA Venture Monitor, Q3-Q4 2024. DPI vintage data (2017: 0.28x median, 0.51x top quartile; 2019-2022: 0.00x median), dry powder ($307B), exit data, and LP net cash flow data (-$169B since 2022).
Carta, “State of Startups 2024-2025.” Bridge round prevalence (29% seed, 26% Series A), down round rates (13.8-16.2%), and seed-to-Series A timeline (761 days median).
Yadav, Rohit. “Rethinking Venture Capital: A Strategic Lens.” 2025.
https://www.rethink.bigbook.vc
. Unicorn holding periods (nearly half of 716 unicorns held 9+ years), $947B locked across 58,000+ private companies, 10-year fund origin (1959), LP allocation reduction data (72%), and family office merchant banking shift.
Burris, Matthew. “The Cost of Company Creation.” Venture Studio Forum, 2025. Cost Per Point of Equity (CPPE) methodology, studio capital efficiency data ($900K all-in, 30-60% ownership), and studio-vs-VC cost basis comparison.
GSSN, “Disrupting the Venture Landscape,” 2020. Studio performance data: 84% seed rate, 72% seed-to-Series-A conversion, 60% inception-to-Series-A rate. Sample: 258 startups from ~40 GSSN member studios.
Wood, Jordan. “The Zombie Fund Problem.” Venture Capital Industry Analysis, 2024. Zombie fund economics ($1B fund / $20M annual fees), GP-led continuation vehicles ($14.6B market), and fund extension incentive structures.
Secondary Market Intelligence, Q4 2024. Secondary dry powder ($9.8B, doubled since 2022), fund stake pricing (60-70 cents on dollar), company-share secondary discounts (10-20%), and total secondary market size (~$60B vs. $3.2T primary value).
SpaceX/Stripe tender offer structures. Recurring Tender Offer model: 6-12 month cadence, 10-20% discount to common, company-controlled cap table management.
InNiches, “Big Venture Studio Research,” 2024. 1,107+ studios globally, 3,452 PitchBook deals analyzed.
Incisive Ventures, “Update on Venture Graduation Rates,” June 2025. Pre-seed to seed: ~45–55%.
Crunchbase, “Far Fewer Seed-Stage Startups Are Graduating To Series A,” January 2025. Mature cohort eventual rates: 51–61% (2017–2020).
Carta via Chronograph, “The Series A Crunch,” February 2025. Two-year rates: 30.6% (Q1 2018) vs. 15.4% (Q1 2022).
Carta State of Seed via SaaStr, December 2025. Four-year rate: 49.1% (2019 Q1 cohort by Q16).
About the Author
Matthew Burris serves as the Senior Director of Research at the Venture Studio Forum, where his mission is to transition venture studios from an emerging asset class to an established asset class. In this role, he leads the creation of the rigorous data frameworks and due diligence standards required for institutional adoption.
This research is built upon the proprietary insights Matthew developed as Partner & Head of Insights at the 9Point8 Collective and study of over 500 venture studios globally. By codifying the methodologies from his advisory work with corporate, university, economic development, and private studios, he provides the Forum with the foundational architecture needed to define the industry.
Connect with Matthew on LinkedIn.